Spectral Enhancements

This map identified feature 1, the bodies of water, using layer 4 in greyscale.

This map identified feature 2, the snow, using a multispectral True Color band combination.
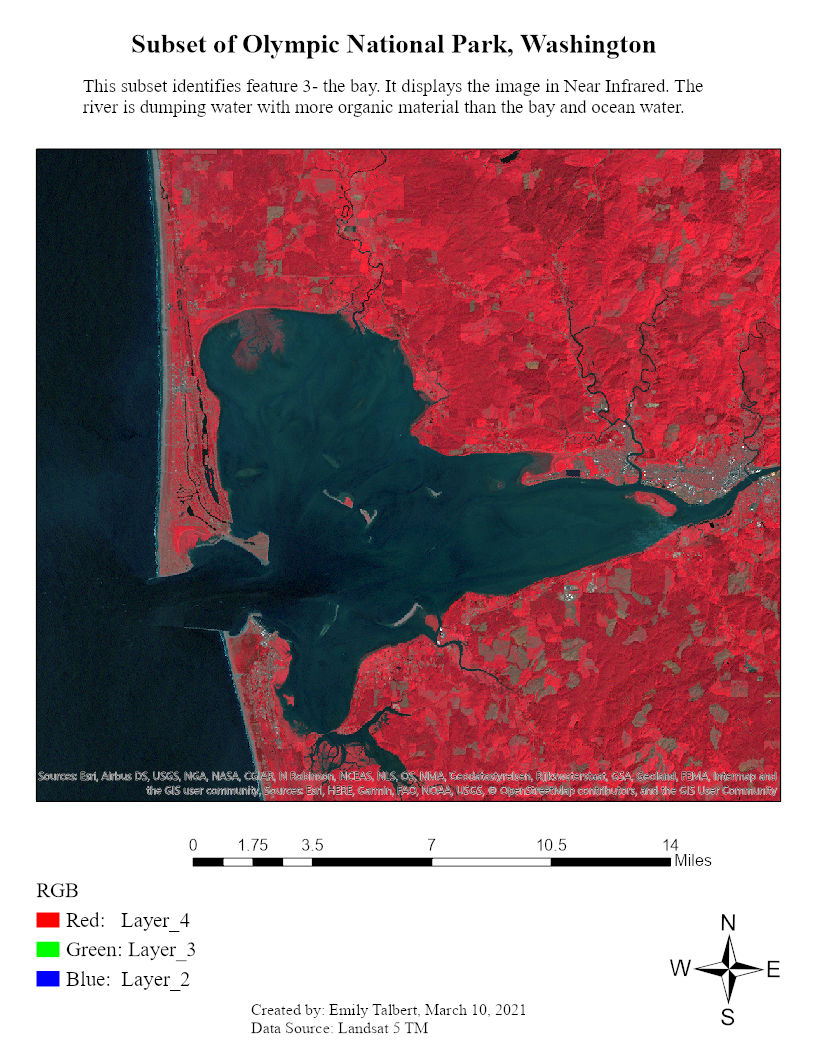
This map identified feature 3, the bay, using a multispectral NIR band combination. It shows the two water systems mixing in the bay.
Comments
Post a Comment