Posts

Showing posts from September, 2021

TIN's and DEM's

Image
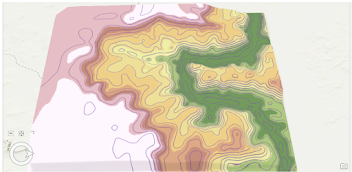
 This week in my special topics course, we worked with TIN's and DEM's. We explored the differences between TIN and DEM elevation models, which I found very interesting.  We made various elevation models with a DEM raster and a TIN. I learned that TIN's are easily able to display various data sets, such as elevation, slope, and aspect. While DEM's require a tool to display these data sets.  I think one exercise made the differences very clear. In that exercise we created contours lines for the DEM and the TIN (Figure 1 and 2). There were very clear differences between the two sets of contour lines. For example, the contour lines of the DEM are much more detailed and organic than the TIN contour lines. It also appears that the DEM contour lines are more accurate because it includes contour lines that the TIN does not include.  Figure 1. DEM contour lines Figure 2. TIN contour lines 

Internship- job searching

 My GIS internship course asked us to research GIS jobs that we would be interested in. I chose to look for archaeology jobs that incorporate or use GIS. I did not look in a particular area or region of the country. I found a decent number of jobs that fit what I was interested in. I did notice that many of them are in the mid-west or west. I also noticed that not many of the positions were entry-level, which worries me a little bit.  We were asked to share our findings in a discussion post. After reading the posts of my classmates, I see that some are worried about some of the same things as me: finding and qualifying for entry-level jobs. It makes me feel better that I am not the only one worried about that. 

Analyzing completeness

Image
In my special topics course, we have been learning about accuracy assessment. This week we focused on completeness and learned how to analyze completeness. The goal of analyzing completeness is to understand how much data is missing. Haklay (2010) argued that accessing completeness helps us understand how useful the data is.  We were given two road networks of Jackson County, OR, and a grid polygon to carry out the analysis. The networks were from TIGER 2000 and a local street centerline network.  I began my analysis by using the batch clip tool to remove any parts of the road networks that were past the boundaries of the grid polygon. Next, I used the intersect tool to intersect each network with the grid layer. I used this tool because it created a new layer with the two layers joined together. I recalculated the sum of the networks’ lengths in kilometers. Then, I used the summarize within tool on both networks. I used this tool because I was able to choose which attributes ...

Internship- Introduction

This semester I will be completing a GIS internship with Dr. John Worth. He is an archaeologist at the University of West Florida and the principal investigator of  the Luna Settlement Project . I will be helping him conduct a variety of analyses on the archaeological data from the site. I am looking forward to applying my GIS skills and learning how to apply them to archaeology. We were also asked to research and join a GIS user group. I chose the Florida Urban and Regional Information Systems Association (FURISA)  because it allows a wide range of GIS professionals. This group covers the entire state of Florida but has nine regions that meet amongst themselves. For example, the Tallahassee region meets quarterly. They recently chose to join URISA, so members will have dual membership. FLURISA is not industry-focused and is open to a variety of professional backgrounds. There is a membership fee, but I did not find any other membership requirements.

Spatial Data Quality Standards

Image
 This week we learned about the various data quality standards, specifically NMAS and NSSDA. In our exercise, we applied the NSSDA methodology to test the accuracy of two maps in Albuquerque, NM. The two maps are from the city of Albuquerque and StreetMaps USA. I used Minnesota Planning's Positional Accuracy Handbook as a reference(1999).  After downloading the provided data and before starting the analysis, I first created my excel spreadsheet based on the worksheet provided by the Positional Accuracy Handbook (Minnesota Planning, 1999). Next, I created a point feature class and selected my 20 sampling points, referenced in Figure 1. I made sure the points were properly distributed, with each quadrant having less than 20% of the points. They are all located at intersections.  Figure 1. 20 sampling points on the city of Albuquerque's map. I then created two more feature classes for the StreetMaps USA map and the reference points. I made sure that I went in the same order ...

Spatial Data Quality

Image
  This week we discussed how to measure spatial data quality. The map layout below includes GPS waypoints, the average GPS waypoint, and three buffers for varying horizontal precision. I calculated horizontal precision by first measuring the distance between the average waypoint and the other waypoints. Then I found the index value for each precision from which I could find the maximum value at that index. This value was the edge of the precision boundary.  To calculate the accuracy of the dataset I inserted the true reference point. I then measured the distance from the true point to the average waypoint. The distance was 3.25 m. This was 1.21m less than the horizontal precision (68%) measurement.  Below is the map layout, I have included the average measurements and the precision measurements.   o Average longitude in decimal degrees 27.825849 o Average latitude in decimal degrees -82.318883 o Horizontal precision (68%) in meters 4.466187 m o Vertical precision (68...