Posts

Internship- GIS Portfolio

 I have created a portfolio of my GIS work and skills. You can find it here:  https://emctalbert.wixsite.com/gisportfolio Part of the final assignment for this course is to record audio or video answering a few sample interview questions. My video is included below.  Part 1:                                                                                                  Part 2: Part 3: Part 4: Part 5:  Part 6:

Internship- GIS Day

I did not have any GIS Day events happening near me, so I decided to celebrate at home. I found a  video  (Links to an external site.) from The GeoSpatial Revolution that briefly discussed the many applications of GIS. I showed this video to my boyfriend, along with some of the maps I have made. The video shared industries that use GIS, such as the military, human rights groups, environmental groups, and political campaign groups. While the video is brief and meant to be a trailer, I think it did a really good job of highlighting how important and intrinsic GIS is. My boyfriend is in the military, so it was really interesting to talk about the types of maps he sees and uses regularly. He noticed that some of the maps I showed him (contour maps) looked like what he uses. It was really cool to find similarities in our professions. 

Internship- Blog post 3

 For this blog post, I decided to share and discuss my Linkedin page. You can see my page here . I worked very hard to update my page a few months ago. I went about updating it by doing a lot of research. I found some really helpful sources that provided do's and dont's, as well as examples.  I wanted my page to be professional, organized, clean, and easy to read. To accomplish this I made sure my text was concise and straight to the point. If someone is visiting my page I want them to quickly understand my background and my current status. I also made sure to showcase all of my skills. I added a link to this blog, a list of my skills, and all of my relevant job experience. Another thing I updated and continue to update, is liking organizations that I am interested in. This is a good way to build my connections and stay informed on my discipline. 

Scale and Spatial Data

Image
 This week was the last module of the Special Topics course! We learned about scale and spatial data. Particularly about the different effects of scale on vector and raster data. With vector data, the scale affects the detail of the data. For example, at a larger scale vector data is much less detailed than the data would be at a smaller scale. The scale of raster data affects the resolution (cell size).  A larger-scale raster (i.e. 90m cell size) is much less detailed than a smaller-scale raster (i.e. 2m cell size). The cell size will also affect the results of any spatial analysis completed, such as slope. Part of the assignment was to determine gerrymandering, which is the manipulating of electoral boundaries to benefit a particular political party. One way to determine it is by measuring the compactness with the Polsby-Popper score (Morgan and Evans 2018). This method creates a score from 0 to 1. In the assignment, I calculated the Polsby-Popper score for the congressional...

Interpolation

Image
 This week we learned about spatial interpolation, specifically Thiessen polygons, inverse distance weighting (IDW), spline, and kriging. Thiessen polygons or nearest neighbor is the simplest interpolation method. It assigns a value to a polygon based on the nearest value. IDW assigns a value based on the closest data point. The spline technique creates a smooth surface by passing through the data set and using a mathematical formula to interpolate. Kriging uses a multivariable formula to interpolate.  We used thiessen polygons, IDW, and spline (regular and tension) techniques to interpolate a data set of water quality in Tampa Bay. Figure 1 shows the results of the regularized spine technique. 

TIN's and DEM's

Image
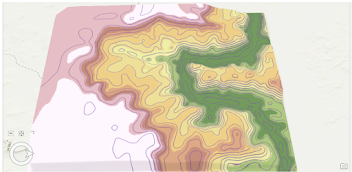
 This week in my special topics course, we worked with TIN's and DEM's. We explored the differences between TIN and DEM elevation models, which I found very interesting.  We made various elevation models with a DEM raster and a TIN. I learned that TIN's are easily able to display various data sets, such as elevation, slope, and aspect. While DEM's require a tool to display these data sets.  I think one exercise made the differences very clear. In that exercise we created contours lines for the DEM and the TIN (Figure 1 and 2). There were very clear differences between the two sets of contour lines. For example, the contour lines of the DEM are much more detailed and organic than the TIN contour lines. It also appears that the DEM contour lines are more accurate because it includes contour lines that the TIN does not include.  Figure 1. DEM contour lines Figure 2. TIN contour lines 

Internship- job searching

 My GIS internship course asked us to research GIS jobs that we would be interested in. I chose to look for archaeology jobs that incorporate or use GIS. I did not look in a particular area or region of the country. I found a decent number of jobs that fit what I was interested in. I did notice that many of them are in the mid-west or west. I also noticed that not many of the positions were entry-level, which worries me a little bit.  We were asked to share our findings in a discussion post. After reading the posts of my classmates, I see that some are worried about some of the same things as me: finding and qualifying for entry-level jobs. It makes me feel better that I am not the only one worried about that.